What 24 years of Canadian capital gains statistics reveal about totals, typical gains, income groups, and provinces
Canadian Capital Gains Atlas
Data coverage: 2000 to 2023 for Canada, the provinces and the territories. Detailed medians and income groups cover 2016 to 2023.
Published: September 2026
Primary source: Statistics Canada tax-return summary tables
In 2023, about 2.64 million people appeared in Statistics Canada’s capital gains data. Together, they reported $98.99 billion in capital gains.
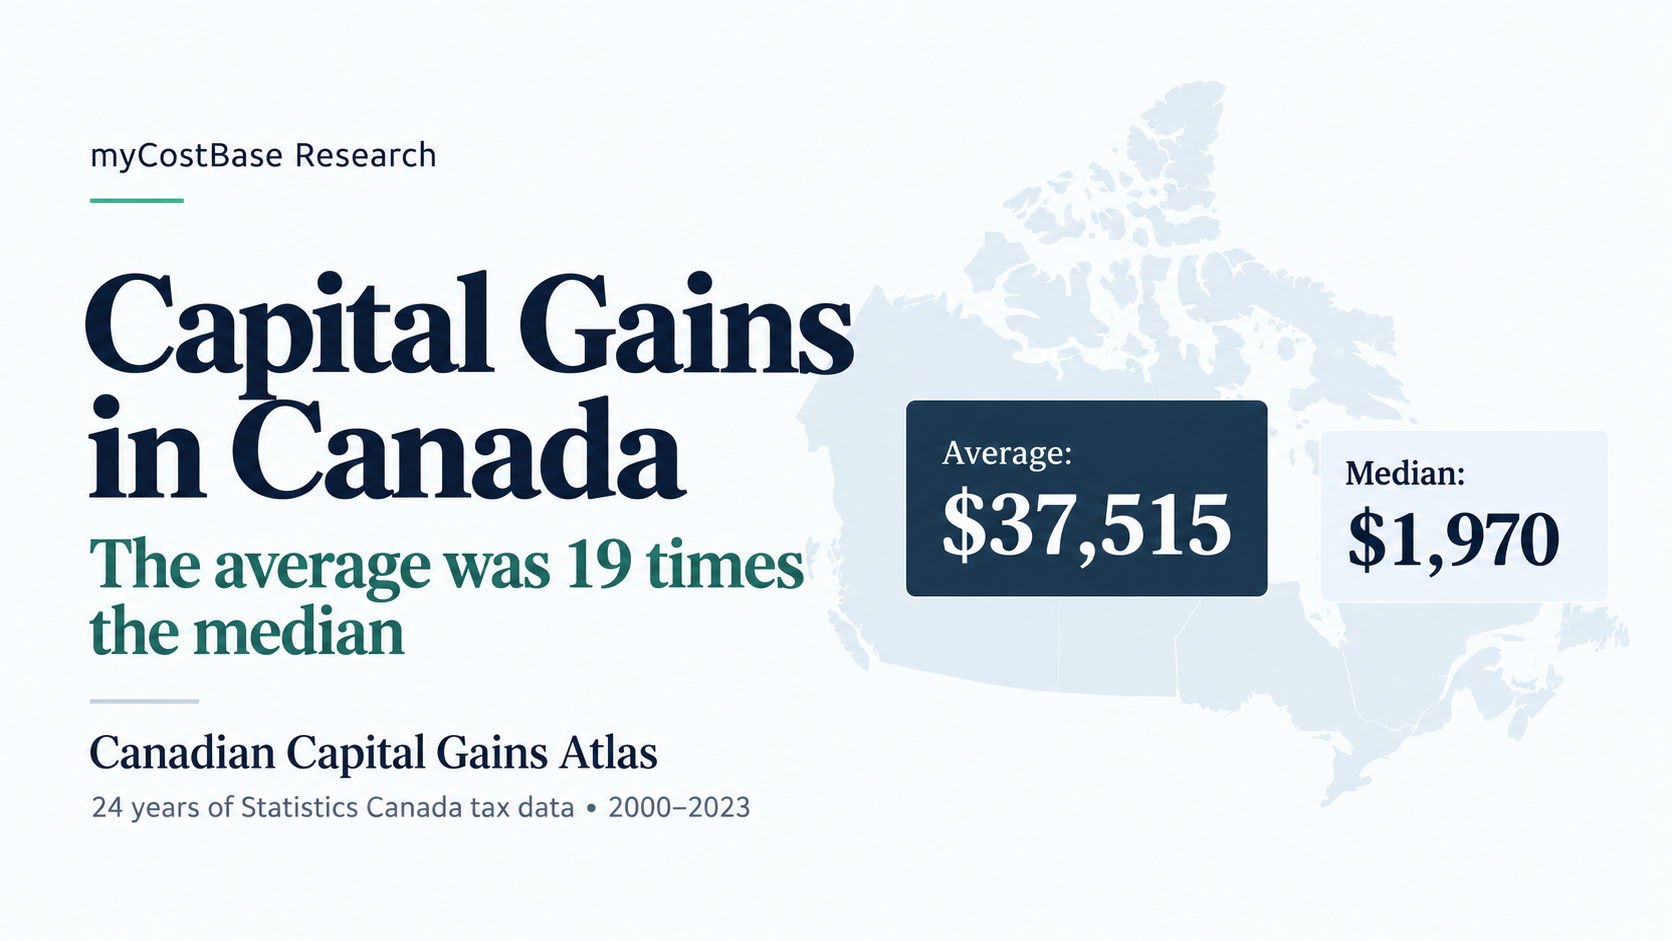
Divide the total by the number of recipients and the average is $37,515. Yet the median, the middle reported result, was only $1,970.
Both figures are correct. They simply answer different questions. The average describes how the total is spread across all recipients on paper. The median tells us what the person in the middle reported. Because a smaller number of large gains can pull up the average, the two figures are far apart.
That 19-to-1 gap is the clearest finding in this report. It is also a useful warning: a single number cannot describe capital gains in Canada very well.
This Atlas uses public Statistics Canada data to examine reported capital gains over 24 tax years. It looks at national trends, the average and median capital gain, the number of recipients, income groups and differences among provinces. The workbook, processed data and interactive explorer are available with the report so readers can check the calculations and explore the figures themselves.
Key statistics
- $98.99 billion in reported capital gains in Canada in 2023
- 2.64 million recipients
- $37,515 calculated average gain, versus a $1,970 published median — the average was 19 times the median
- 56.4% of reported gains came from the $100,000-and-over income group
Source: myCostBase Research, Canadian Capital Gains Atlas, 2026.
The short answer
Three findings explain most of the story:
- The average was 19 times the median. In 2023, the calculated average reported gain was $37,515, compared with a published median of $1,970.
- Reported gains grew much faster than the number of recipients. From 2016 to 2023, inflation-adjusted reported gains rose 64.0 percent, while the recipient count increased only 0.6 percent.
- The leading province depends on the measure. Manitoba had the highest calculated provincial average in 2023. British Columbia had the highest published median.
You can open the interactive Canadian Capital Gains Explorer to choose a geography, income group and year. Readers who want the exact values can use the downloadable data workbook .
Calculate ACB in a saved account and maintain one history across your taxable brokerages.
- Hosted in Canada
- No broker or CRA passwords
- Export your records anytime
- Prices in CAD · No credit card for Free
What these capital gains statistics include
The data come from tax-return summaries, not a survey of investors. They cover capital gains reported in the underlying tax records and can include gains from investments, real estate, businesses and other property.
The tables do not identify which asset produced a gain. They cannot tell us how much came from stocks, exchange-traded funds, rental properties or the sale of a business. They also do not show a person’s brokerage, account type, adjusted cost base, holding period or number of trades.
For that reason, this report uses the phrase reported capital gains. It does not describe stock-market returns or unrealized gains that still exist only on paper.
Statistics Canada publishes the amounts in these tables on a grossed-up basis. They should not be doubled again. The program also excludes tax filers who died during the reference year and may omit some late filers. Full definitions are available in the T1 Family File program documentation .
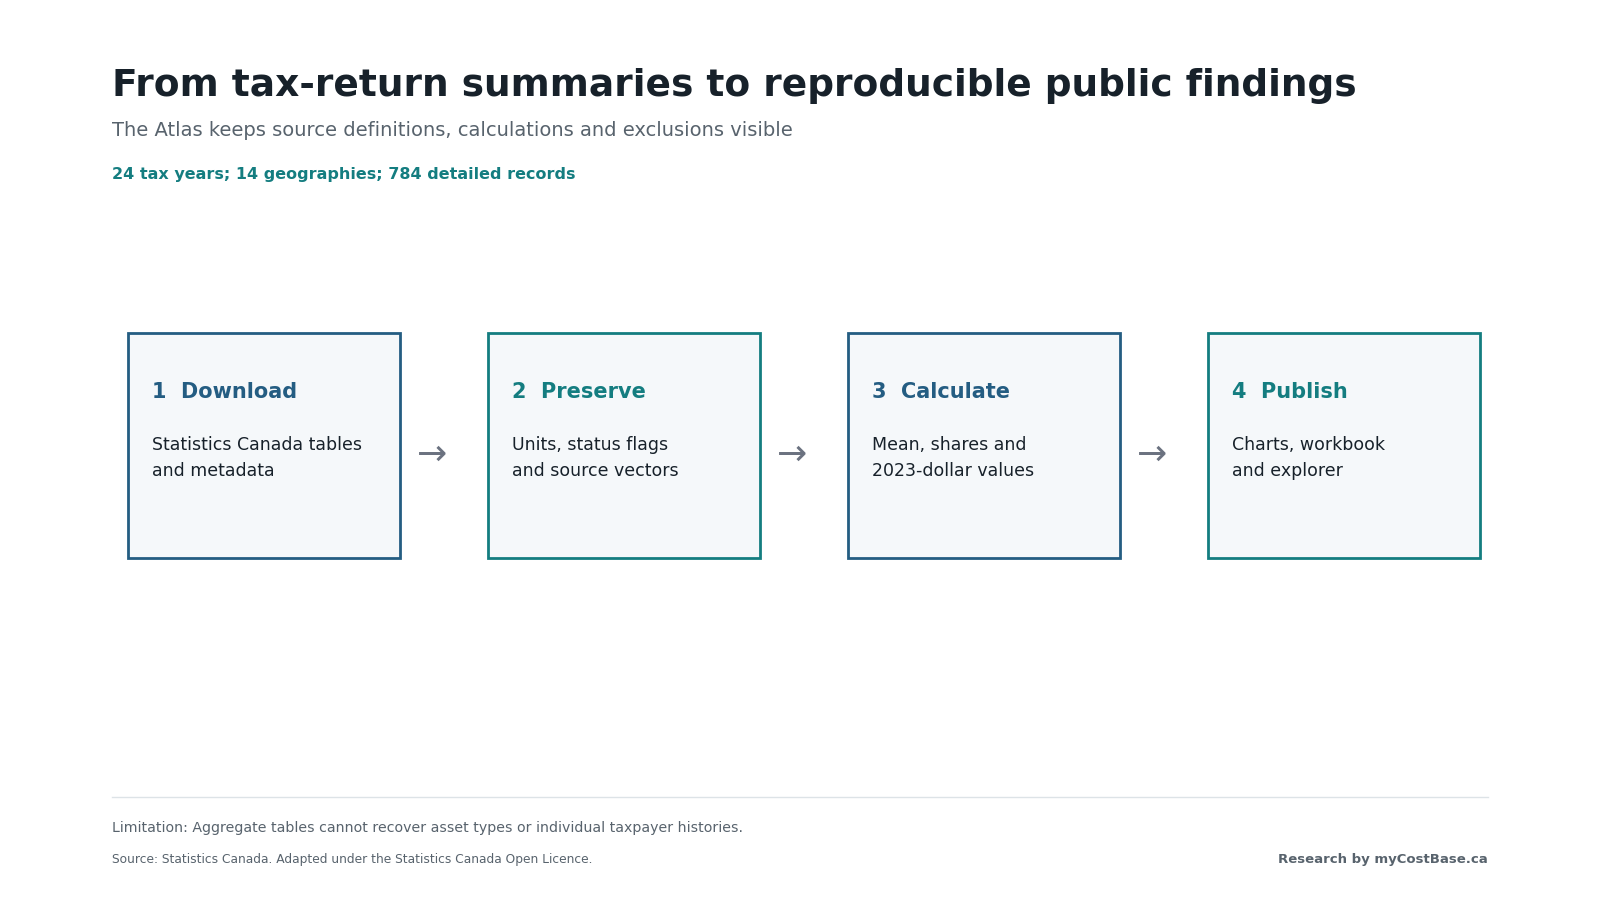
Figure 1. The Atlas keeps the source definitions, missing values and calculations visible. Aggregate tax data cannot recover information that was never published.
The average capital gain in Canada was not the typical result
Statistics Canada recorded 2,638,700 recipients and $98,989,580,000 in reported capital gains for 2023. Dividing the amount by the recipient count produces an average of approximately $37,515.
The same source publishes a median of $1,970. That is the middle value: half of the reported results were below it and half were above it.
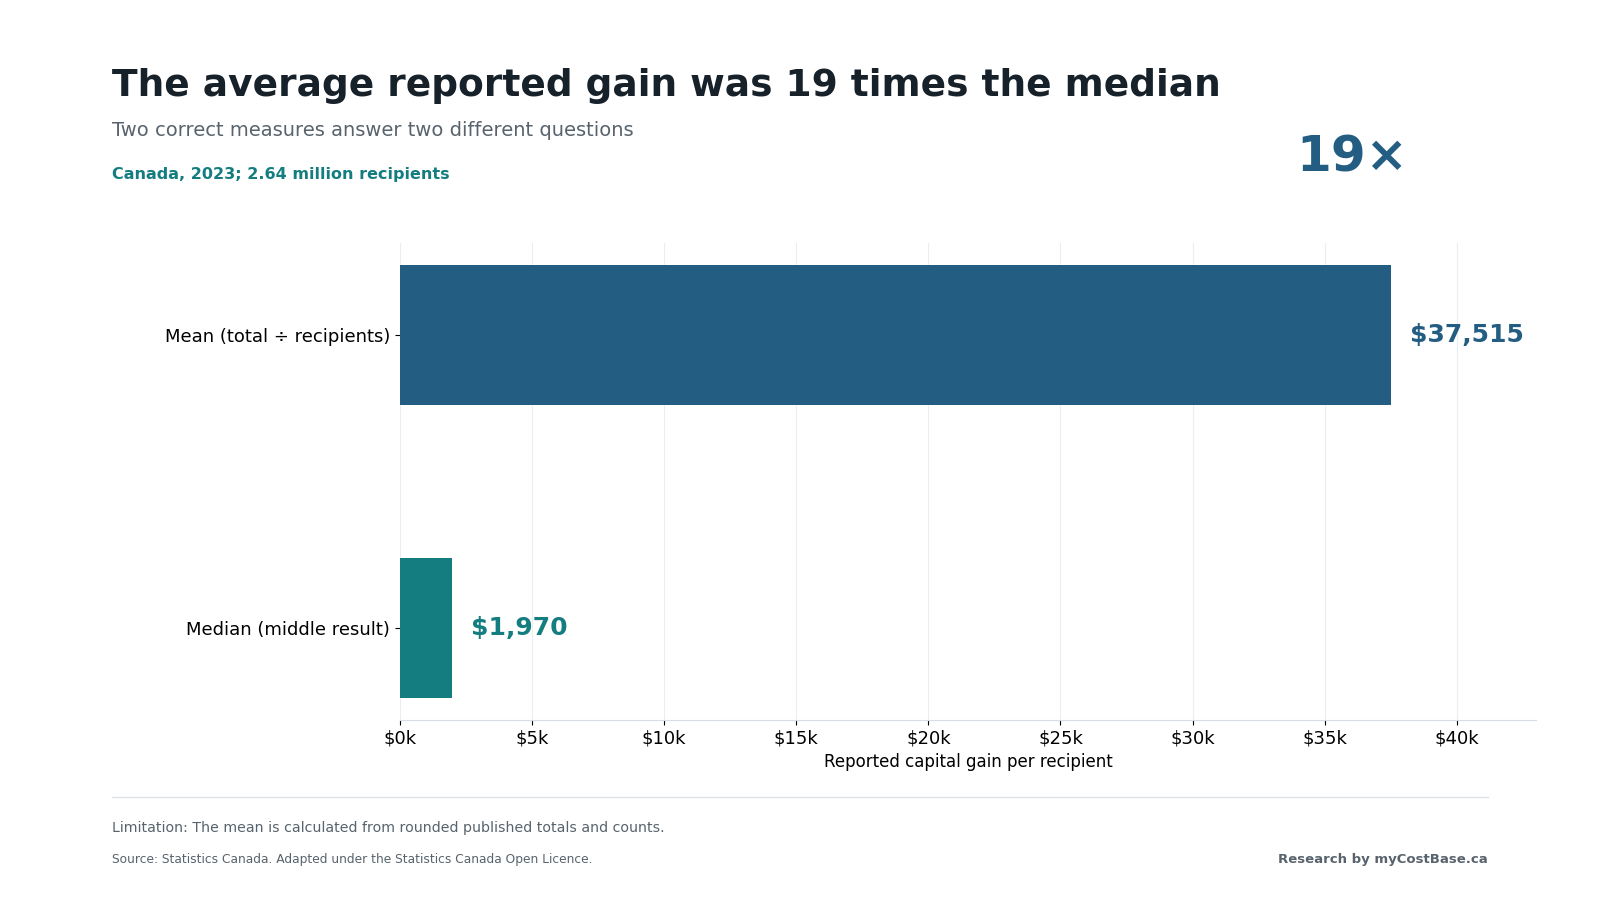
Figure 2. The calculated average was about 19 times the published median in 2023. Source: Statistics Canada Table 11-10-0070-01 .
The large gap tells us the distribution is uneven. Bigger gains near the top raise the average, while the median stays anchored to the middle recipient.
It does not tell us exactly how much went to the top one percent. The public table contains totals, counts and medians, but it does not provide the individual records needed to calculate detailed percentiles.
This distinction matters because “average capital gain in Canada” can be misunderstood. The $37,515 figure is not the average for every Canadian. It is the total reported gain divided by the number of recipients included in this Statistics Canada series. The median is usually closer to what readers mean when they ask what a typical recipient reported.
| Canada in 2023 | Value | What it means |
|---|---|---|
| Reported capital gains | $98.99 billion | Total recorded amount |
| Recipients | 2.64 million | People recorded in the series |
| Calculated average | $37,515 | Total divided by recipients |
| Published median | $1,970 | Middle reported result |
| Average-to-median ratio | 19.0 times | A sign of a highly uneven distribution |
The median also has limits. It does not follow a household over time, show whether the gain came from one sale or many, or reveal how long an asset was held. The most honest reading uses the average and median together.
Reported capital gains reached a record in 2021
The national total moves sharply from year to year. Reported capital gains were $46.76 billion in 2007, $26.78 billion in 2008 and $22.33 billion in 2009. They later climbed to $139.71 billion in 2021, the highest nominal total in the series, before declining to $102.54 billion in 2022 and $98.99 billion in 2023.
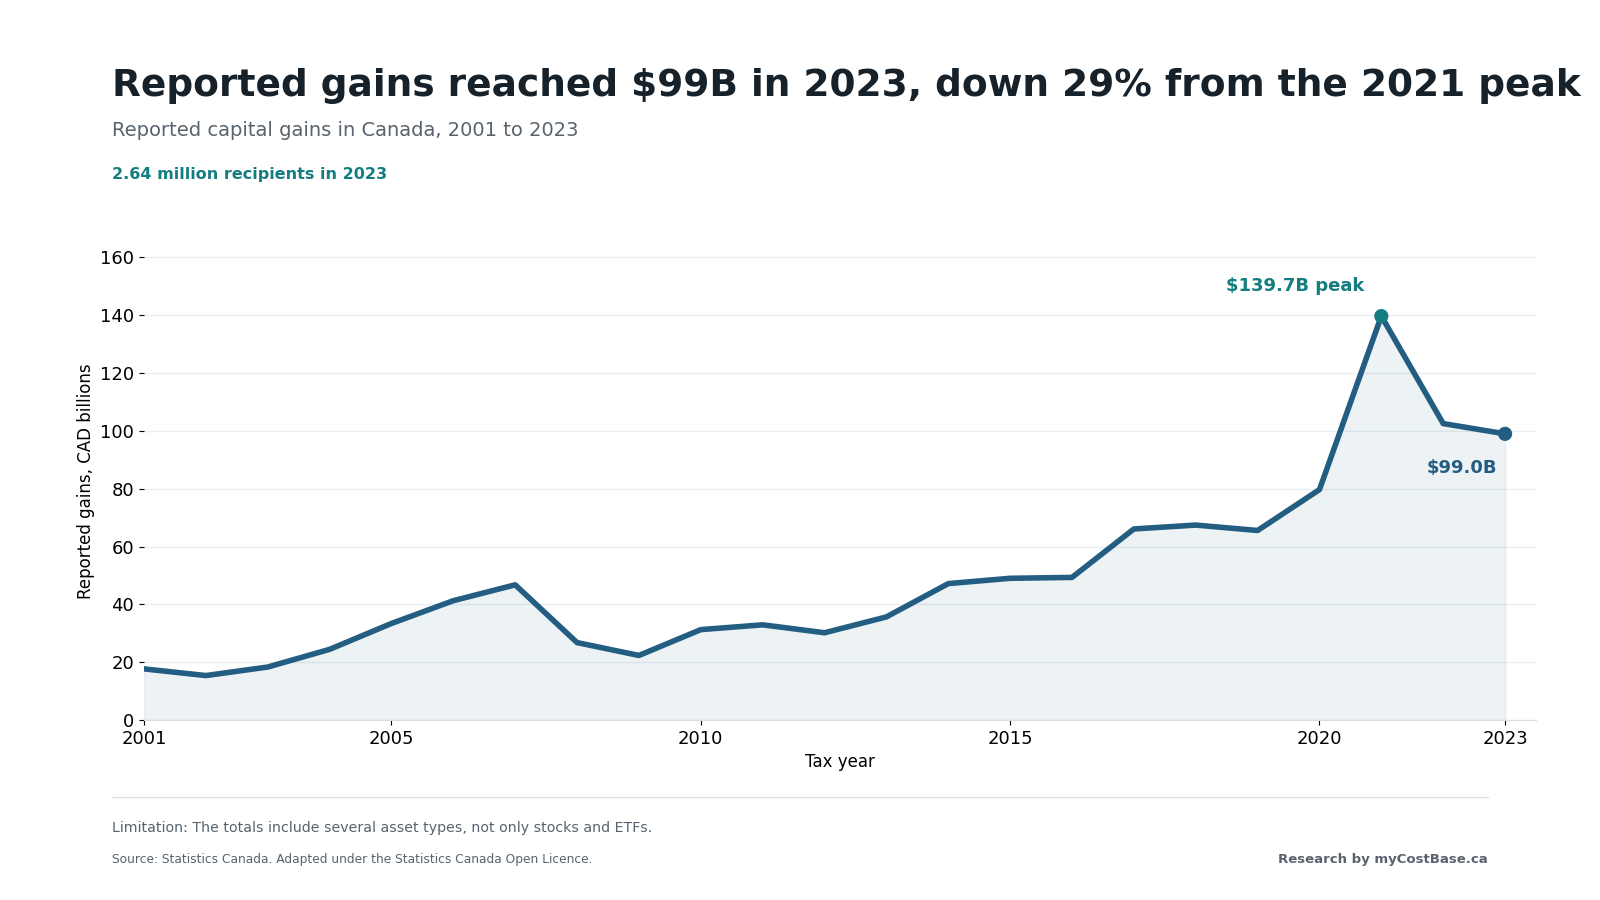
Figure 3. Nominal reported capital gains in Canada from 2001 through 2023. Source: Statistics Canada Table 11-10-0034-01 .
The 2023 total was 29.1 percent below the 2021 peak in nominal dollars. After adjusting both years to 2023 purchasing power, the decline was 36.1 percent.
Inflation adjustment helps compare the size of totals across years. It does not change how an individual calculates adjusted cost base or reports a taxable capital gain. Those are separate tax calculations.
The chart begins in 2001 even though the downloadable dataset contains 2000. The earlier observation needs extra context because of historical changes to the capital gains inclusion rate. Keeping 2000 in the data preserves the record, while starting the main visual in 2001 makes the long-run comparison easier to read.
The peaks and declines should not be treated as a direct measure of stock-market performance. People decide when to sell assets, and the data include more than publicly traded securities. The table also cannot prove why a particular year rose or fell.
| Tax year | Recipients | Reported gains | Gains in 2023 dollars |
|---|---|---|---|
| 2001 | 1,479,750 | $17.68 billion | $28.40 billion |
| 2007 | 2,795,310 | $46.76 billion | $65.88 billion |
| 2009 | 1,121,710 | $22.33 billion | $30.66 billion |
| 2016 | 2,622,350 | $49.32 billion | $60.35 billion |
| 2021 | 3,577,040 | $139.71 billion | $155.01 billion |
| 2022 | 2,726,330 | $102.54 billion | $106.54 billion |
| 2023 | 2,638,700 | $98.99 billion | $98.99 billion |
The workbook includes every year, rather than only the selected years shown above.
More reported dollars did not mean many more recipients
Total gains and recipient counts answer different questions. The dollar total shows how much was recorded. The recipient count shows how many people appeared in the series.
From 2016 to 2023, nominal reported gains increased 100.7 percent. After inflation, the increase was 64.0 percent. The number of recipients rose by only 0.6 percent.
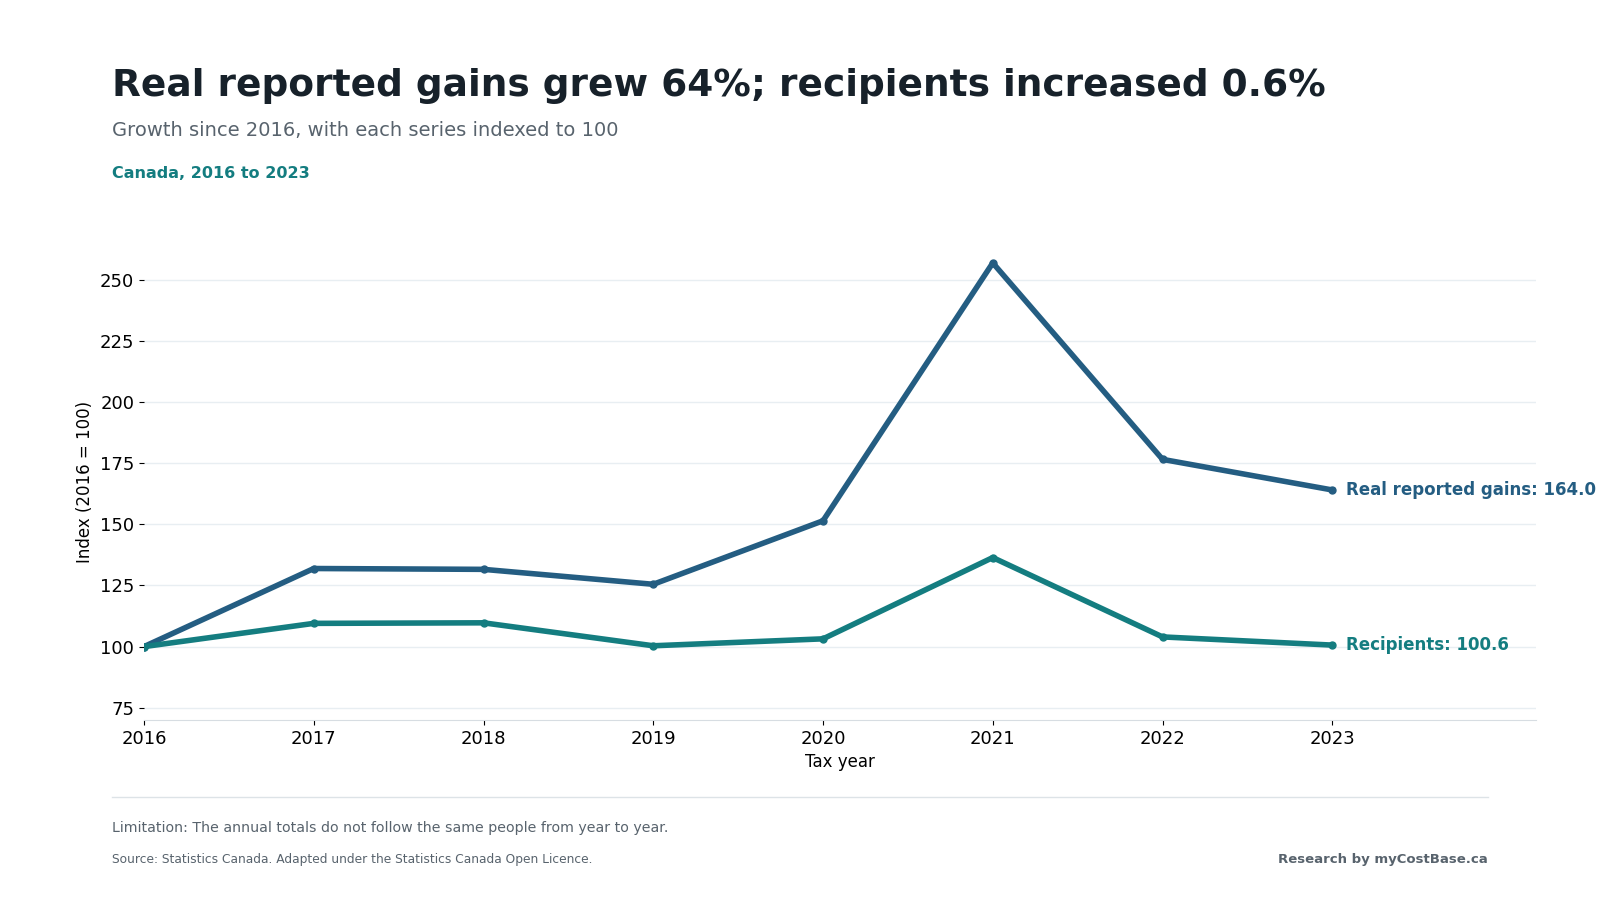
Figure 4. Both measures start at 100 in 2016. By 2023, real reported gains reached an index value of 164.0, while recipients reached 100.6. Sources: Statistics Canada tables 11-10-0034-01 and 18-10-0005-01 .
The result does not mean the same people increased their gains by 64 percent. The public data are annual summaries, so the people included can change from one year to the next. A person might report one large sale, several smaller gains or no gain in the following year.
The result is still informative. It shows that the growth in recorded dollars did not come with a similar rise in the number of recipients. Larger gains among some recipients, a different mix of recipients or both could produce that pattern. The aggregate table cannot separate those explanations.
Higher-income recipients accounted for most of the total
Statistics Canada divides recipients into six income groups. In 2023, the $100,000-and-over group made up 31.1 percent of recipients and accounted for 56.4 percent of reported capital gains.
There is an important definition beside that finding: the source measures income before capital gains are added. The bands are not wealth brackets. A person can report a large capital gain and still appear in a lower source-defined income group.
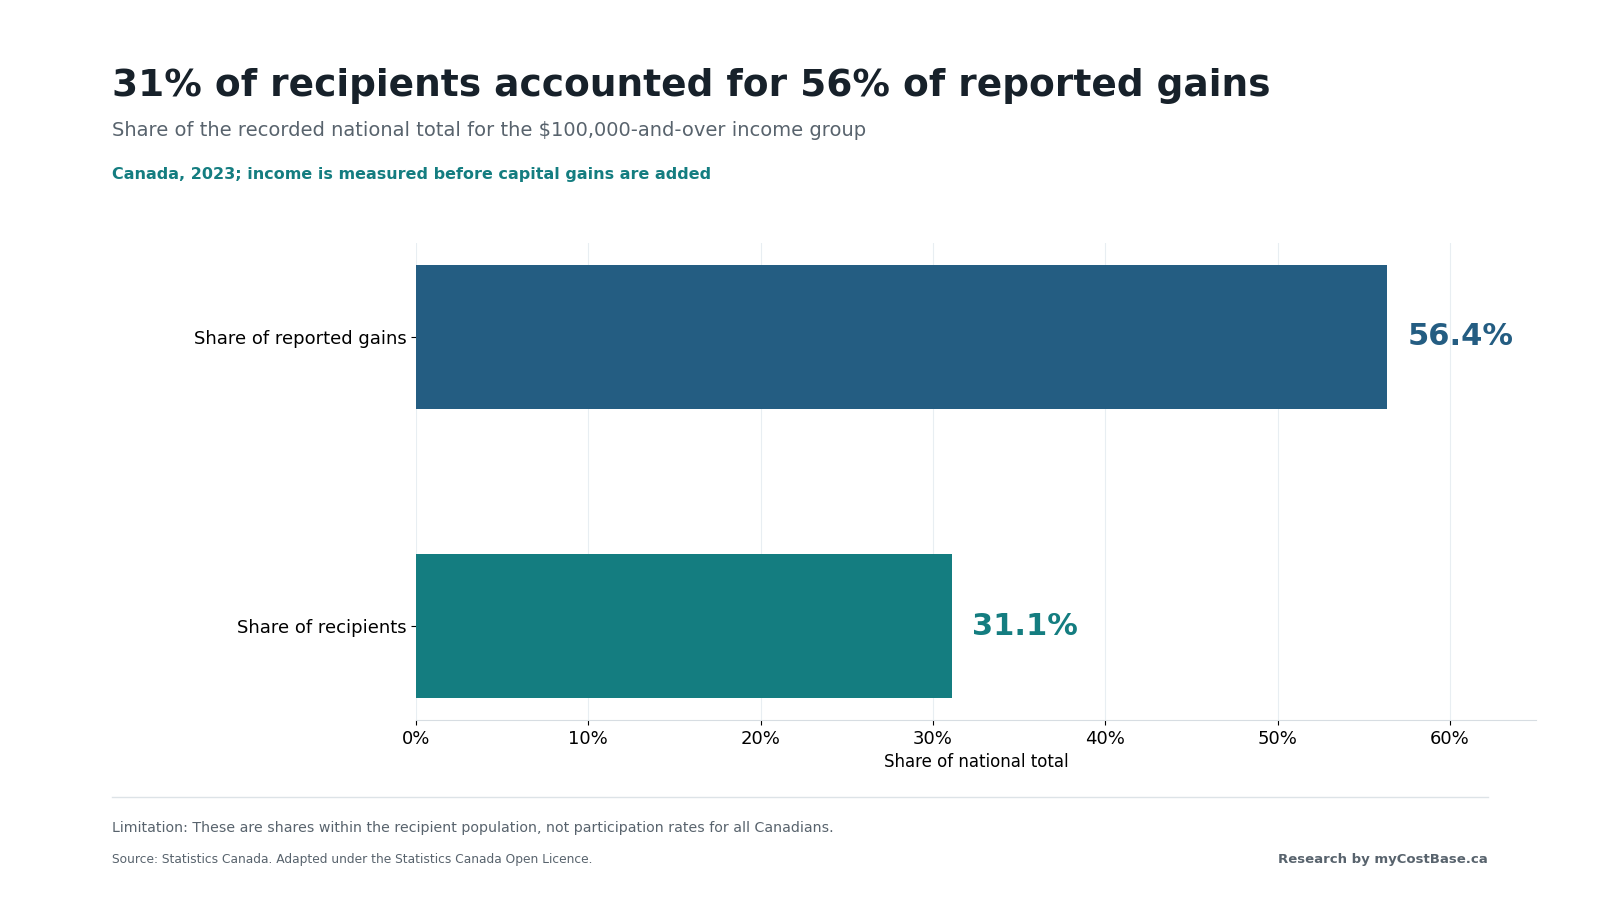
Figure 5. The $100,000-and-over group represented a much larger share of reported gains than of recipients. Source: Statistics Canada Table 11-10-0070-01 .
| Income excluding capital gains | Recipients | Share of recipients | Share of gains | Median gain |
|---|---|---|---|---|
| Under $20,000 | 251,820 | 9.5% | 10.9% | $1,730 |
| $20,000 to $39,999 | 460,340 | 17.4% | 8.9% | $1,560 |
| $40,000 to $59,999 | 440,390 | 16.7% | 8.7% | $1,690 |
| $60,000 to $79,999 | 378,510 | 14.3% | 8.2% | $1,750 |
| $80,000 to $99,999 | 287,270 | 10.9% | 7.0% | $1,820 |
| $100,000 and over | 820,380 | 31.1% | 56.4% | $2,940 |
The lowest income group illustrates why the definition matters. It accounted for about $10.80 billion, or 10.9 percent of reported gains. That does not mean 10.9 percent of gains went to households with total economic resources below $20,000. The records refer to individuals, and the gain being studied is excluded when the income group is assigned.
The medians are also closer together than the total dollar shares. Across the six groups, the published median ranged from $1,560 to $2,940. Large gains can shape the total for a group without moving its middle value nearly as much.
These are shares within the capital gains recipient population. They are not the percentage of all Canadians in each income group who reported a gain. A proper participation rate would require a compatible denominator with the same population, year, geography and income definition.
Capital gains by province depend on whether we use the average or median
Provincial rankings change depending on the measure.
Manitoba had the highest calculated average among the ten provinces in 2023 at approximately $57,329 per recipient. Its published median was $1,700.
British Columbia had the highest published median at $2,400. Its calculated average was approximately $38,087.
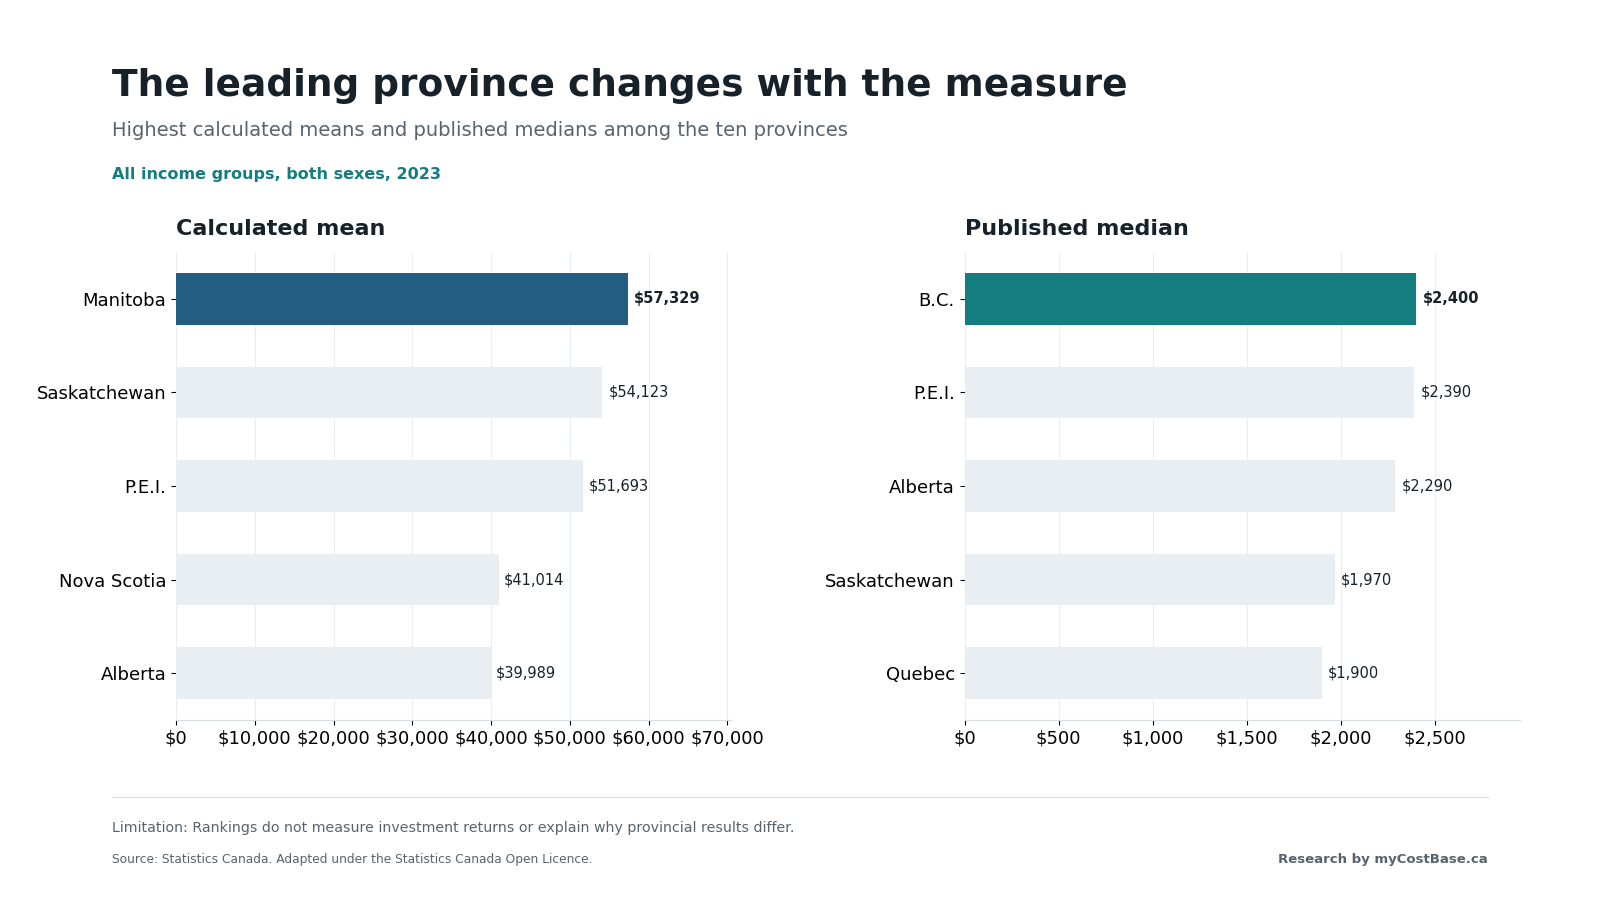
Figure 6. Manitoba ranked first by calculated average, while British Columbia ranked first by published median. Source: Statistics Canada Table 11-10-0070-01 .
The measures describe different parts of the distribution. Manitoba’s total was high relative to its recipient count, which raised its average. British Columbia’s middle reported result was higher, even though its average did not rank first.
The source does not explain why the provinces differ. It contains no asset mix, transaction size, holding period or recipient history. It would therefore be speculation to attribute Manitoba’s average to a particular investment or industry without another dataset.
Small differences also need careful language. British Columbia’s median was only $10 above Prince Edward Island’s $2,390. The values can be ranked, but such a small gap should not be presented as evidence of a meaningful economic difference.
The static chart focuses on the provinces for readability. Yukon, the Northwest Territories and Nunavut remain in the workbook and interactive explorer.
The typical gain rose only 8 percent after inflation
The national median was $1,490 in 2016, climbed to $3,300 in 2021 and fell to $1,970 in 2023.
After converting the 2016 value to 2023 dollars, it equals approximately $1,823. That makes the inflation-adjusted increase from 2016 to 2023 about 8.1 percent.
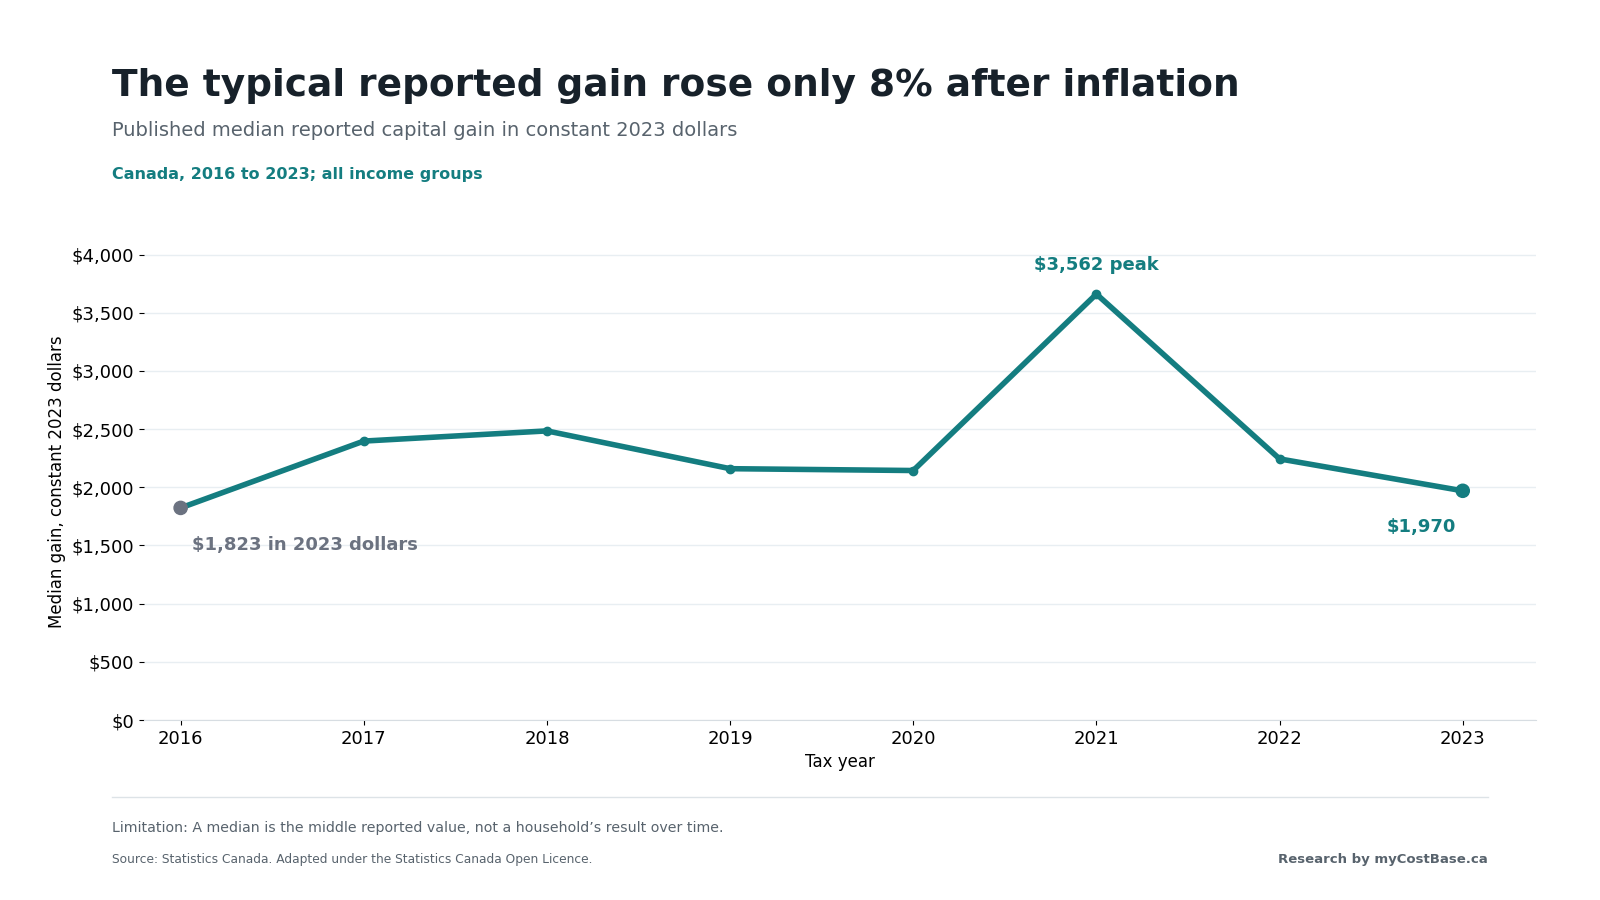
Figure 7. The published national median expressed in constant 2023 dollars. Sources: Statistics Canada tables 11-10-0070-01 and 18-10-0005-01 .
The median’s 8.1 percent real increase is much smaller than the 64.0 percent rise in the aggregate real amount over the same endpoints. The two calculations are not in conflict. The total includes every reported dollar, while the median follows the middle reported value.
This is why capital gains statistics should always identify the measure. Total gains, average gains, median gains and recipient counts can move in different directions, even when they come from the same table.
Explore and download the Canadian capital gains data
This report’s underlying data is published as the Canadian Capital Gains Dataset — 2000–2023.
The interactive explorer lets readers select a geography, income group and year from 2016 through 2023. It displays reported gains, recipients, the calculated average and the published median. Monetary values can be shown in nominal dollars or constant 2023 dollars.
The data workbook contains:
- the national series from 2000 to 2023;
- provincial and territorial values;
- 2023 income-group results;
- source identifiers and calculation notes; and
- a read-me page describing the fields.
The downloads are ungated. No account or email address is required.
For readers who prefer open, machine-readable files:
- Download the national capital gains series (CSV)
- Download the 2023 income-group data (CSV)
- Download the 2023 provincial and territorial data (CSV)
- Download the release manifest (JSON)
How the Atlas was calculated
The analysis uses three Statistics Canada tables:
- Table 11-10-0034-01 for long-run recipient counts and reported capital gains;
- Table 11-10-0070-01 for medians and income groups; and
- Table 18-10-0005-01 for Canada’s annual all-items Consumer Price Index.
The detailed dataset contains 784 geography, year and income-group records reconstructed from 3,920 selected source rows. The long-run dataset contains 336 geography-year records.
The two capital gains tables overlap from 2016 through 2023. We compared 224 recipient and amount values across 112 geography-year combinations. Every selected value matched after applying the source scalars. This confirms that the extraction and unit conversion agree across the two tables, although it is not an independent check against a different administrative system.
| Measure | Calculation | Qualification |
|---|---|---|
| Calculated average | Reported gains divided by recipients | Published totals and counts are rounded |
| Inflation-adjusted amount | Nominal amount multiplied by 2023 CPI and divided by that year’s CPI | Used for historical comparison, not tax reporting |
| Share of gains | Group amount divided by the same year and geography total | Describes composition, not participation |
| Share of recipients | Group recipients divided by the same year and geography total | Does not use all Canadians as the denominator |
| Median gain | Published directly by Statistics Canada | Group medians are never added or averaged |
Three detailed records have unavailable medians, all involving Nunavut income groups in 2022. The dataset keeps those fields missing instead of replacing them with zero or estimating them.
The source data are rounded and sometimes suppressed to protect confidentiality. Component values may not add perfectly to the published total. Calculations use the underlying processed values, while displayed figures are rounded for readability.
What this report cannot tell us
The Atlas can compare recorded totals, recipients, averages, medians and income-group composition. It cannot:
- identify whether a gain came from stocks, ETFs, real estate, a business or another asset;
- calculate an individual’s adjusted cost base, taxable capital gain or tax payable;
- show how many transactions produced a reported amount;
- follow the same people from year to year;
- calculate the percentage of all Canadians who reported a gain without a matching denominator;
- explain why a province or year has a higher average; or
- prove that a market event or policy change caused a movement in the series.
For an individual estimate based on your province, taxable income, proceeds, and adjusted cost base, use the Canadian capital gains tax estimator . It is separate from this population-level research and does not calculate a complete tax return.
These boundaries do not make the data unhelpful. They tell us which conclusions the public records can support and where a different dataset would be needed.
Frequently asked questions: Canadian Capital Gains Atlas
What was the average capital gain in Canada in 2023?
Among recipients in Statistics Canada’s 2023 capital gains series, the calculated average was approximately $37,515. This is the total reported amount divided by 2.64 million recipients. It is not an average for every Canadian.
What was the median capital gain in Canada in 2023?
The published median was $1,970. The median is the middle reported value and is much lower than the average because large gains pull the average upward.
How much was reported in capital gains in Canada in 2023?
Statistics Canada recorded approximately $98.99 billion in reported capital gains for 2023, down 29.1 percent from the $139.71 billion peak in 2021.
Which province had the highest capital gain?
It depends on the measure. Manitoba had the highest calculated average in 2023 at about $57,329. British Columbia had the highest published median at $2,400.
Do these figures include only stocks and ETFs?
No. The data can include gains from investments, real estate, businesses and other property. Statistics Canada does not identify the asset type in these tables.
Why does the report end in 2023?
The latest tax year available in the selected tables is 2023. Statistics Canada has announced a transition from the T1 Family File to T1FF Plus and a delayed schedule for 2024 data. The next update should review the new schema and definitions before extending the trend.
Calculation and review notes
This Atlas is based on Statistics Canada data made available under the Statistics Canada Open Licence . Adaptation of the data does not imply Statistics Canada endorsement.
The report was researched and published by myCostBase, which develops capital gains recordkeeping software. The Atlas and its downloads are provided as public references without an account or email gate. Optional product links are separate from the research findings.
Charts may be reused with their built-in attribution and a link to this report. The workbook and processed files preserve the source table, year, geography, units and calculation fields needed to trace the published findings.
How to cite this research
myCostBase Research (2026). Capital Gains in Canada: The Average Was 19 Times the Median. https://mycostbase.ca/blog/capital-gains-canada-average-vs-median/
Sources
Calculate ACB in a saved account and maintain one history across your taxable brokerages.
- Hosted in Canada
- No broker or CRA passwords
- Export your records anytime
- Prices in CAD · No credit card for Free